For any business, not just warehousing, data is everything, it drives the behaviour from how orders are prioritised in a warehouse to ensure they are shipped to you on time to how people vote in national elections!
How SAMS Works
FOR ANY BUSINESS, DATA IS EVERYTHING
Design Custom SQL Reports and Charts
- Use the parameter control panel to create Interactive charts using [substitution variable] input or create drill down reports
- Using the Category and Value widgets to control the way your data is displayed, using available colour palettes
- Joining Data from Different Sources – We have adapters and scripts that allow joining data together from different sources such as Excel or any database using SQL reporting
- Using our smart cache functionality, reduce the load on your database by using data that has already been mined
- Connect to any API using our in built API Console that allows you to connect to any system that uses Web Services
Develop Custom Menus
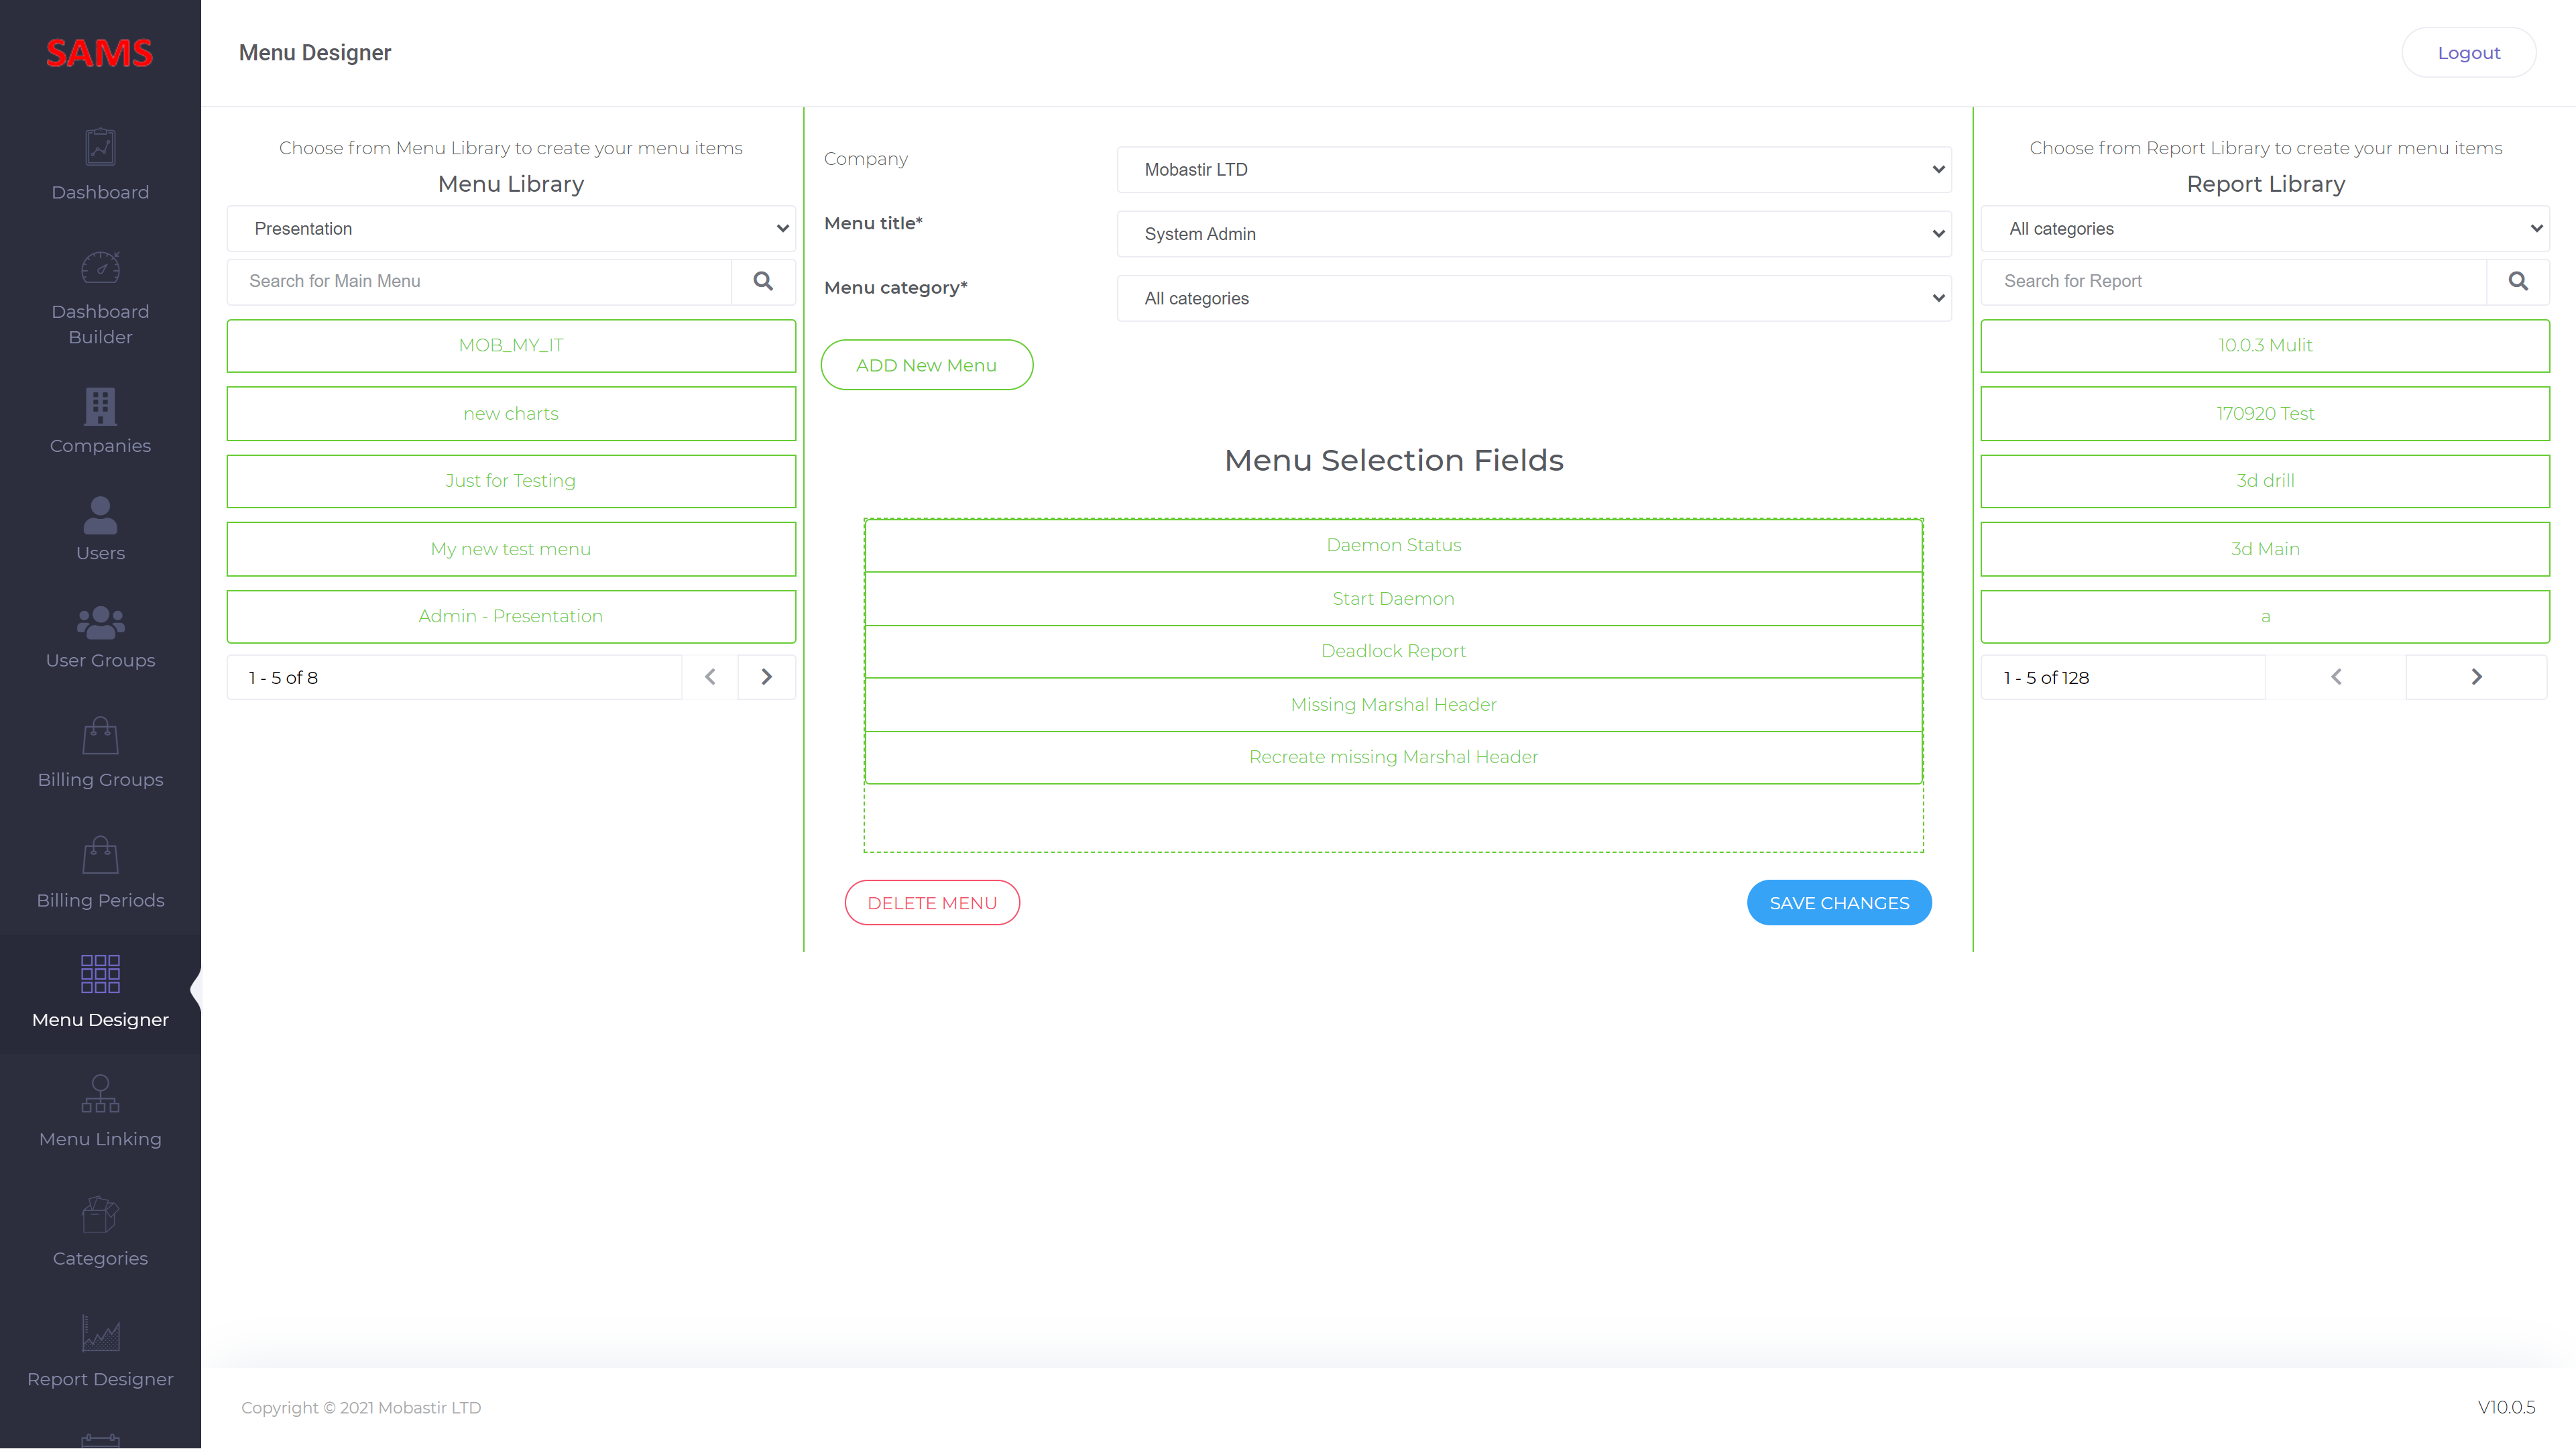
- Build menus using the Menu Designer tool
- Create Custom Menus – For example, using sub menus for each department or area
- Assign reports and charts into menus so they can be accessed at any time
- Link user groups with menus so you can control who has access to the data that is relevant to them
- Create Operational or Departmental Profiles so you can assign reports and data queries to the people that need it
- As a 3rd party you can create your own customer portal for providing visibility to your clients
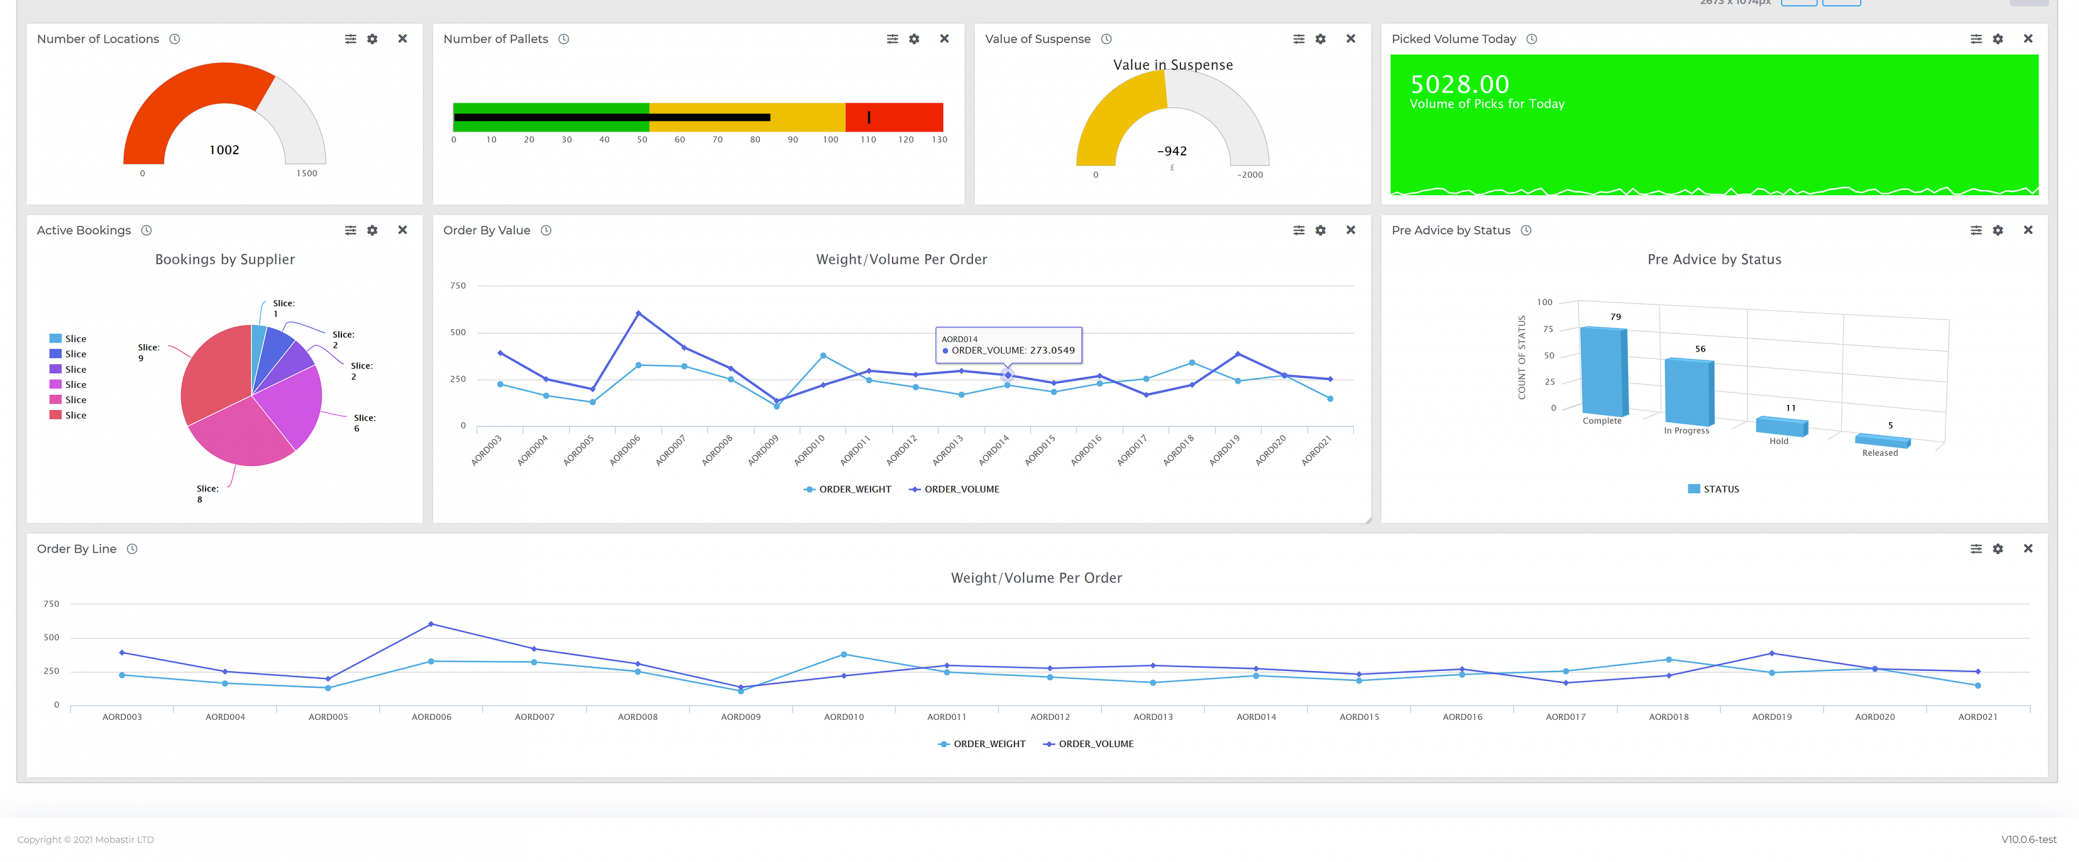
Create Custom Business Dashboards
- Build your own custom dashboards, from WMS Dashboards / Warehouse dashboards to SQL Dashboards, if it has a data source we can create business dashboards to suit your requirements!
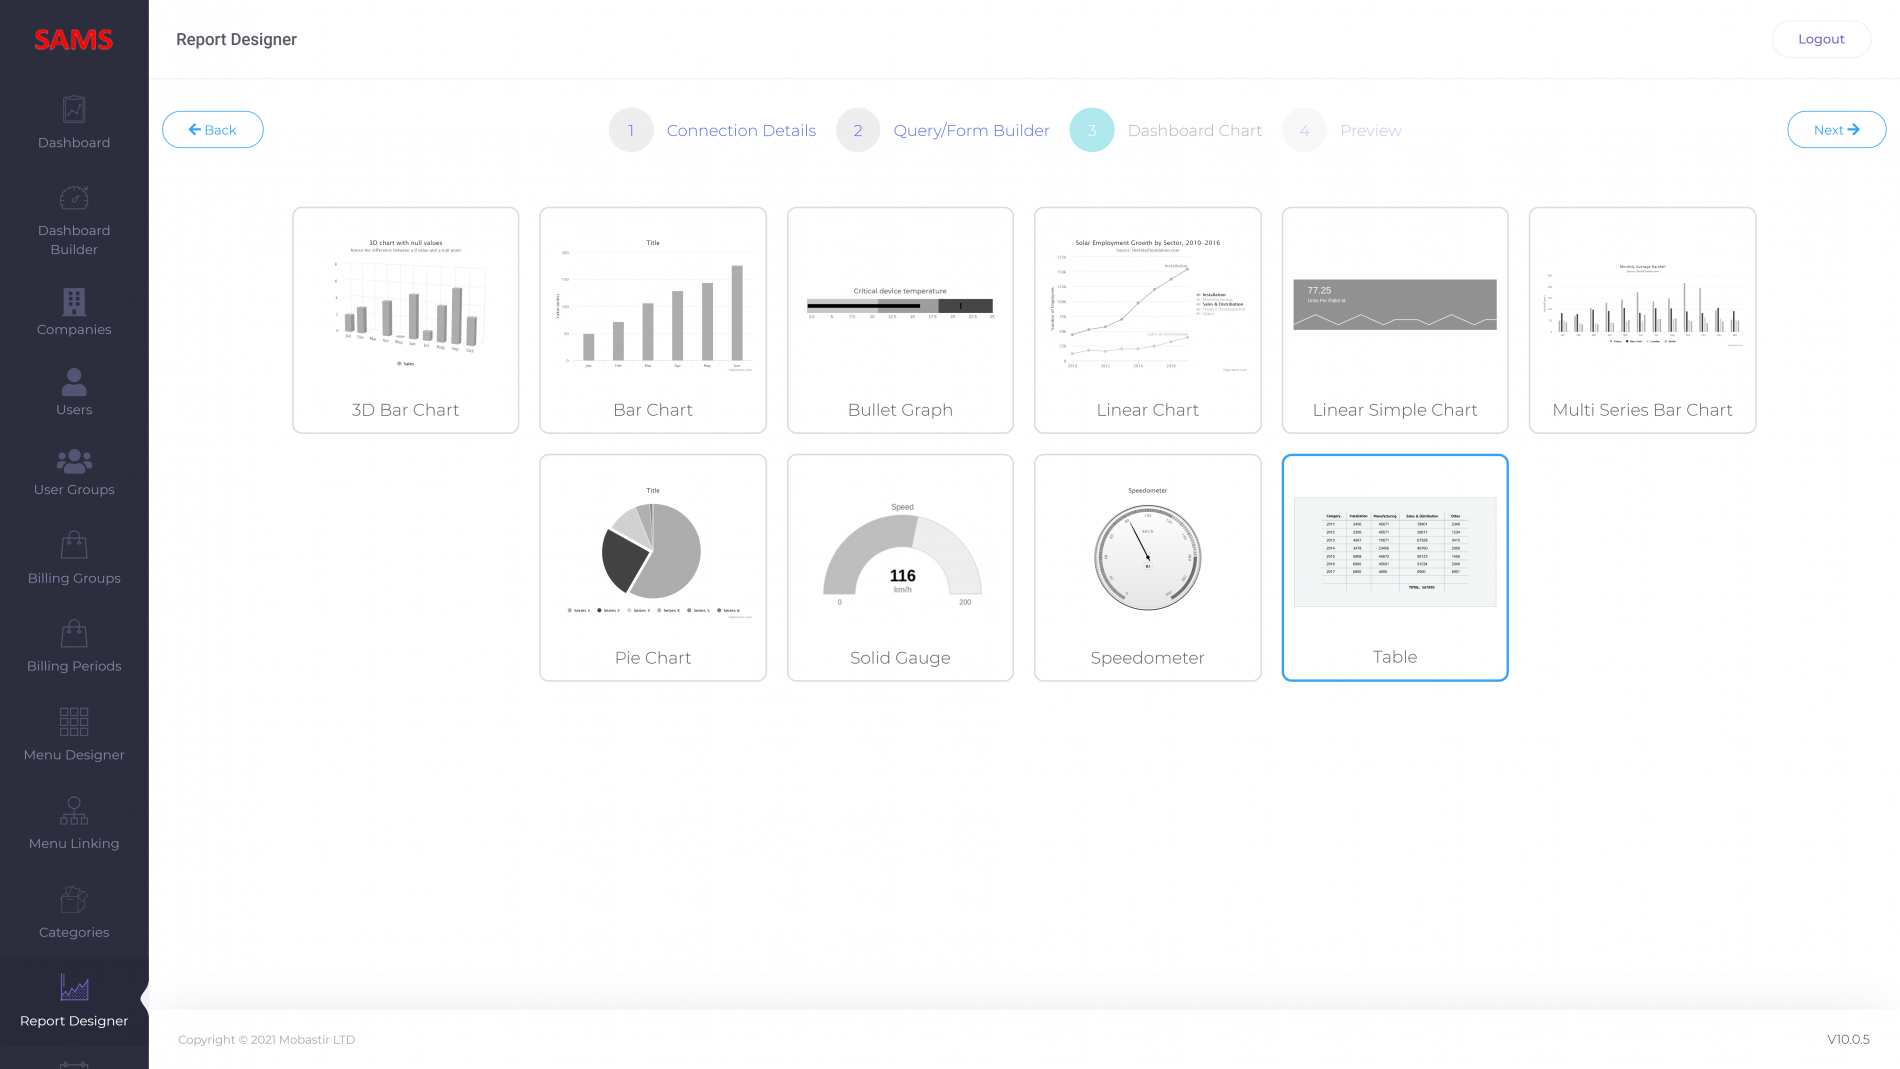
- Choose from a library of charts and widgets to display your data
- Add threshold measures to display widgets with a custom colour scheme of your choice
- Add conditional Formatting and Totals to your Tabular view so you highlight the relevant data in a clear way
Push Notifications and Event Management
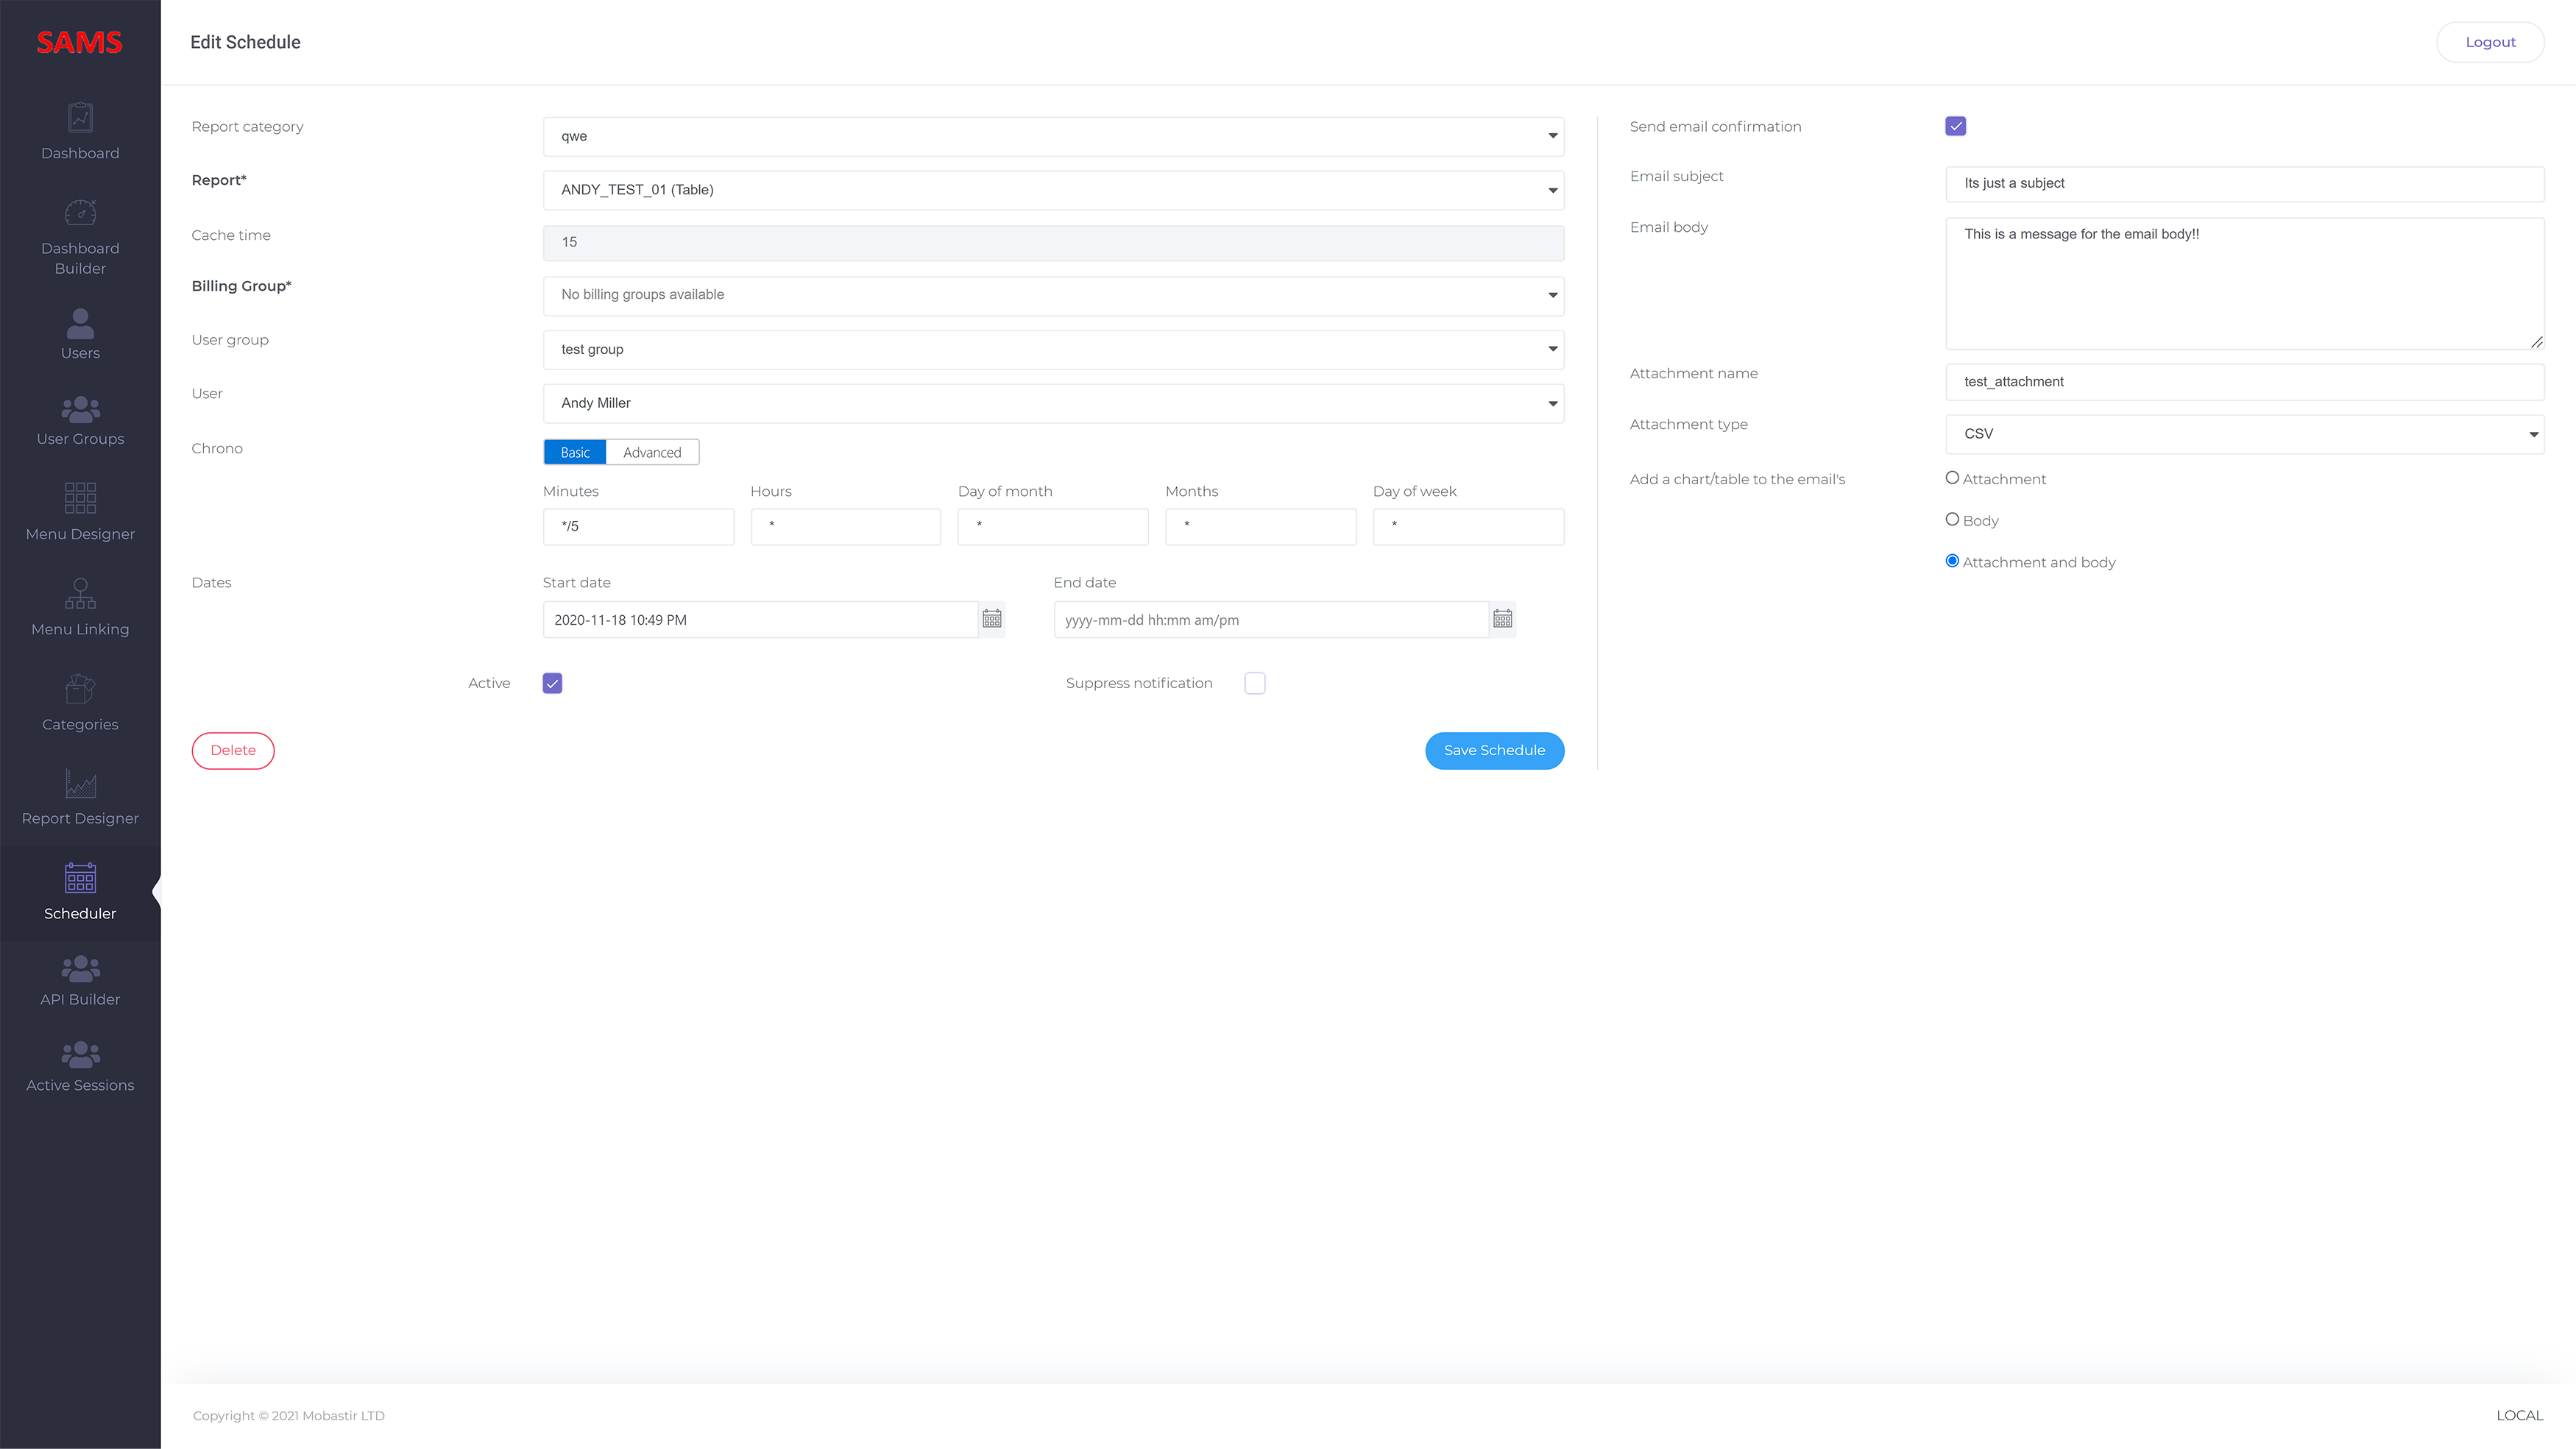
- Using our built-in scheduler, setup events or alerts to trigger emails or push notifications to user devices
- Choose to send alerts to the SAMS app on your mobile device
- Alerts to specific users or configured user groups
- Send output to emails as CSV / PDF attachments
- Embed the chart image into the body of the email using our smart conversion tool
- Trigger the scheduler to run at any interval you can imagine, from date range to specific days of the month, we have it covered!
Cloud Hosted Business Dashboards
Host on the Cloud via our AWS Platform
or On-Premise
- Your security is our number 1 priority
- Even in the cloud, when we need to access your data on your premises you do not need to open and compromise any ports. We use proprietary HTTPS technology to extract your data with no compromise to your security
- We have options to suit your needs, please speak to us for more information


Want to learn more?
If you have any question on how SAMS could work for you, please get in touch today.